
The right kind of technical analysis can yield useful predictions, however. The decision support engine, a technical analysis system that tracks a wide range of data and looks for historical patterns that are likely to repeat themselves, has yielded accurate predictions about the broad market since early August. Here are just a few of the articles describing its forecasts that were published before the market's behavior confirmed them.
1. Aug. 7, 2015: "The Stock Market is Getting Ready to Plummet, but Volatility Will Soar"
Must Read: 4 Stocks With Most Elite Dividend-Grower Status
3. Sept. 29, 2015: "Stocks Will Make a Multiweek Bounce Before the Coming Market Collapse"
Last Wednesday, there was an article titled, "5 Reasons the Stock Market Will Move Sharply Lower Soon," which highlighted the decision support engine's latest forecast. This prediction still awaits the market's manifestation. In August, we asked whether this year's big selloff would be like 2007-2008 or 1929. Updated information shows that there still are reasons to expect either of those scenarios, but right now the 2007 analogue has a slight edge.
If this is the market's path, the S&P 500's (^GSPC) rise off the Aug. 24 low has mimicked the rise off the March 2008 low into the lower high in May 2008. That May high marked the last escape before the next 10 months saw the S&P 500 lose 53%. If that happens in the next 12 to 24 months, the S&P 500 will test the 1050 zone.
Click here to see the following chart in a new window
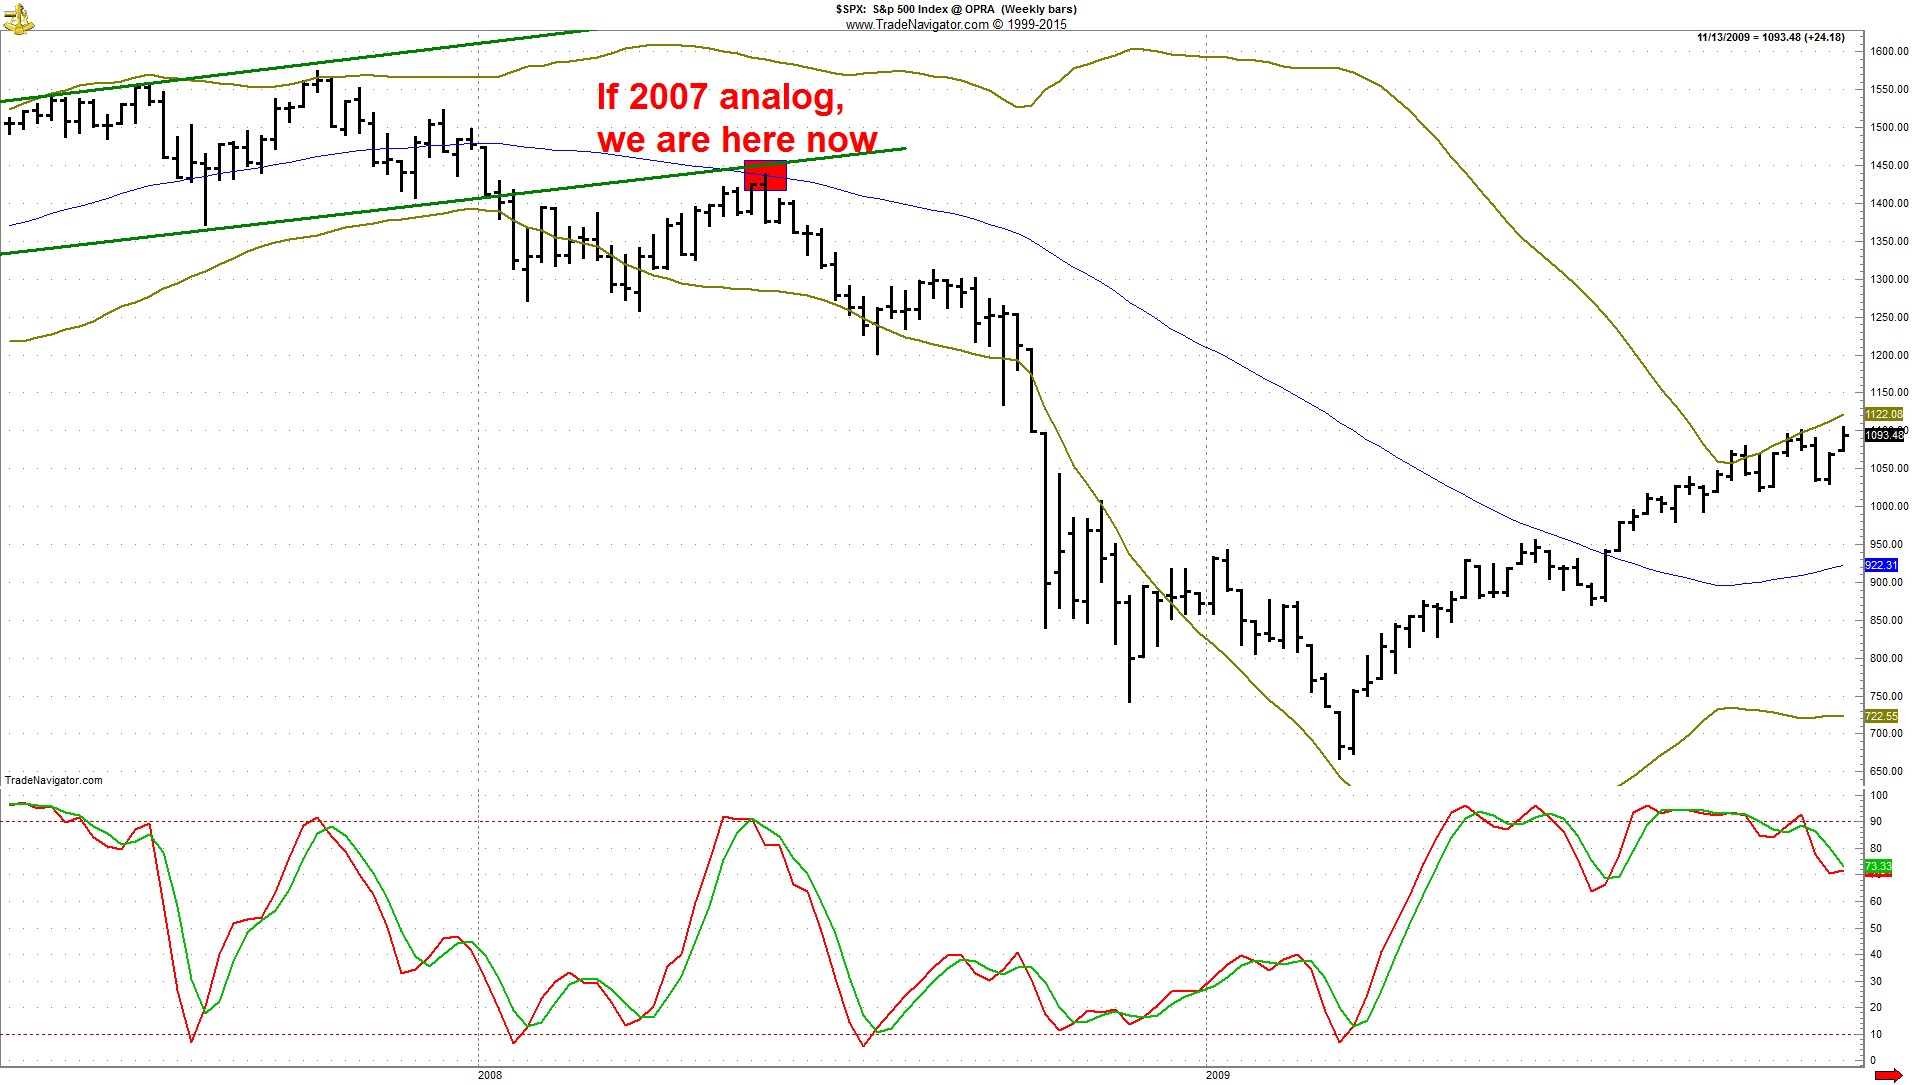
This weekly bar chart of the S&P 500 above shows the peak in 2007, the decline into March, then the rise to lower highs in May. That May 2008 high intersected the just-broken lower channel line (thick green line) from the underside, as well as the 200-day moving average (thin blue line) from the underside, in a classic "kiss goodbye" of long-standing previous support (which is now resistance).
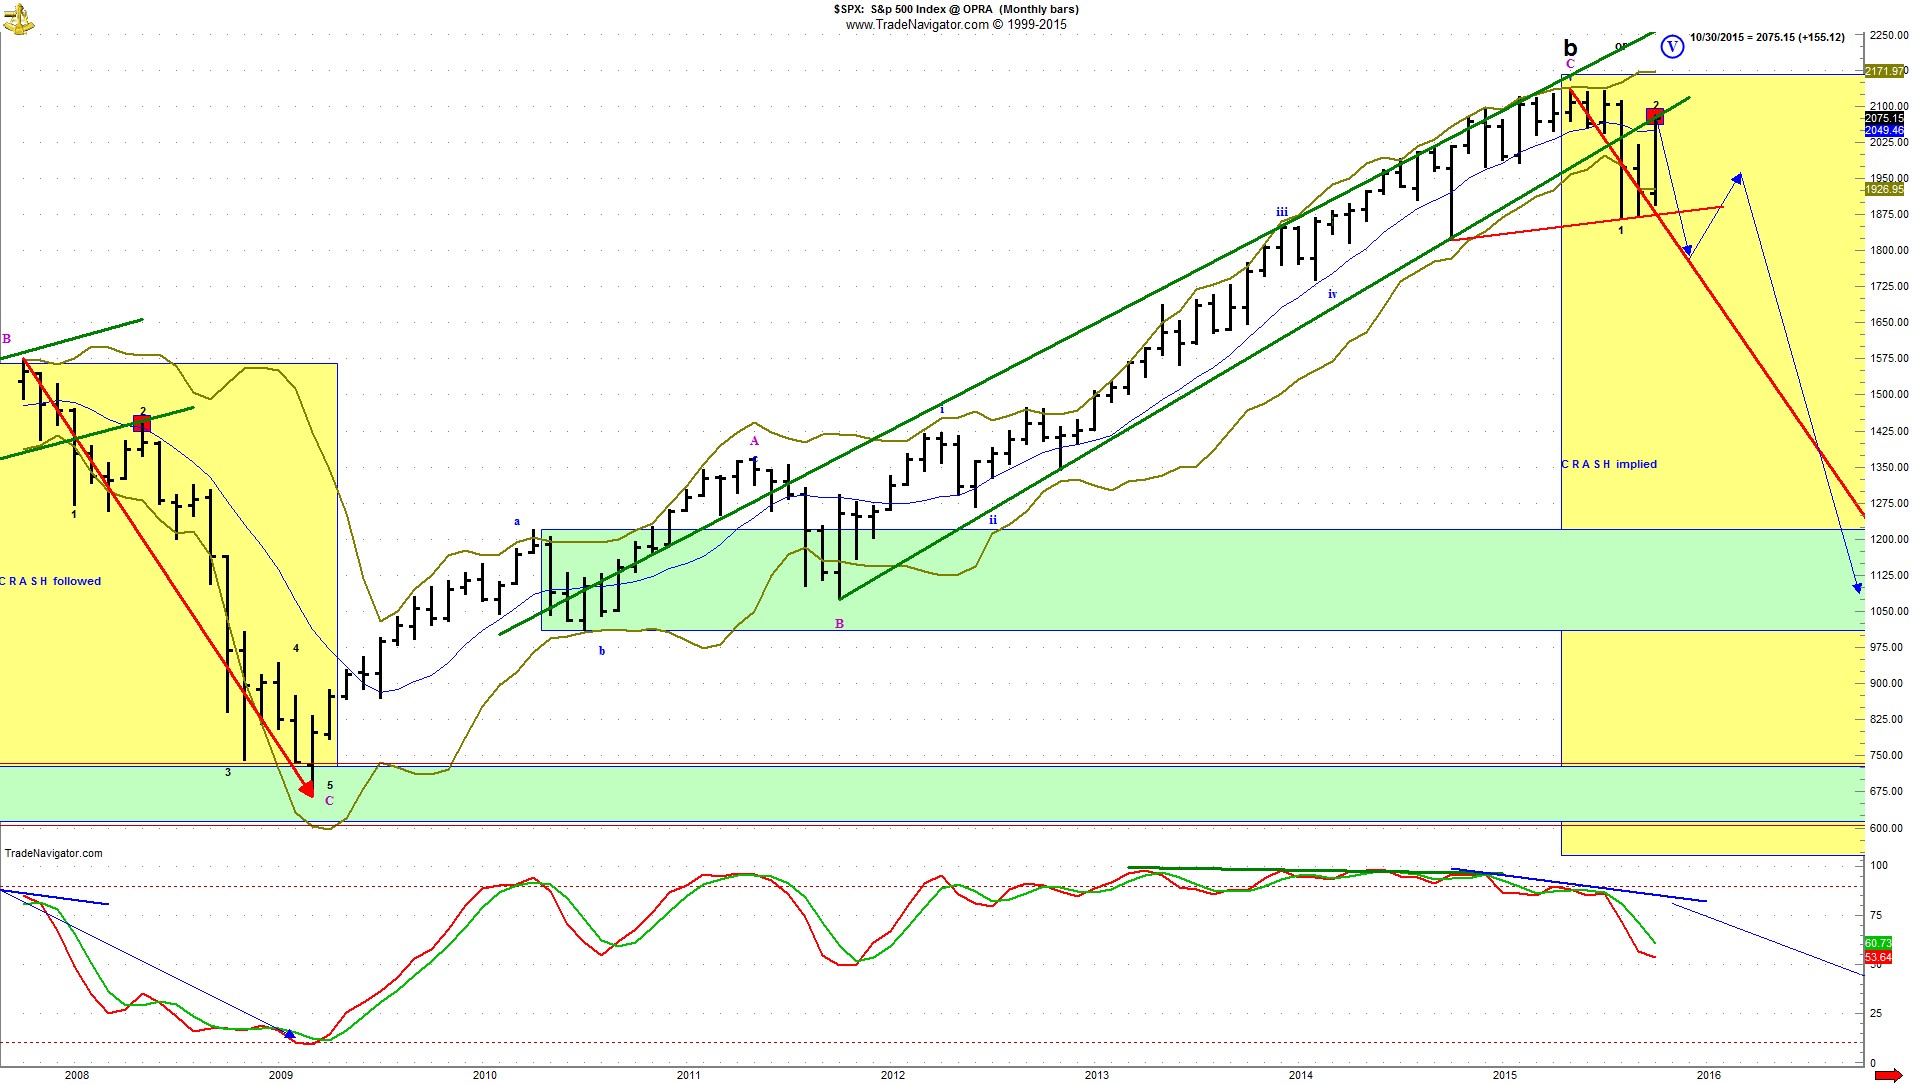
The second chart is a monthly bar chart, and it shows how the current scenario echoes that of 2007-2008. The red box from the first chart is translated to the 2008 time frame, and the current scenario shows one, as well. Notice that the lower just-broken channel lines, 200-day moving averages, and even the initial touch of the lower two-standard-deviation band (olive/gold line) are all eerily similar. Then, drop down into the stochastics pane and you will see the bold blue lines there highlighting the lower highs in stochastics vs. higher highs in prices in the months leading into the 2007 and 2015 peaks. Finally, the current stochastics are in free fall, represented by the red stochastic widening the distance from the green stochastic.
Must Read: The Week Ahead: Will Stocks Stay in the Black?
If the 1929 analogue is in play, prices will streak to higher highs by New Year's Eve, if not Thanksgiving or even Halloween! All that is needed to satisfy the pattern is an S&P 500 print above 2135 (less than 3% higher Friday's close), while higher targets can be calculated to 2400 +/-25. However, the conditions of waning volume, momentum, and breadth, coupled with extreme complacency (i.e., the CBOE Volatility Index, or VIX), bullishness (record New York Stock Exchange margin usage) and certainty that the Federal Reserve "has our backs" put this bubble into rarefied territory. Bulls are likely to get slaughtered in the near future.
The decision support engine is warning strongly that this is not the time to be using buying actions in your portfolio (except for marrying some put options to your beloved long positions). Rather, selling actions are indicated, which means selling long positions, using sell stops to protect profits and selling short. Sell, sell, sell!
For more of this kind of analysis, join our new real-time, live-market analysis chat room. Come benefit from decision support engine analysis from bell to bell, addressing indices and stocks, as well as member questions throughout the day. Special founding member pricing is available for TheStreet.com readers who subscribe early, after enjoying a complimentary trial week.
This article is commentary by an independent contributor. At the time of publication, the author held shares of ProShares Trust UltraPro Short QQQ ETF (SQQQ).
No comments:
Post a Comment