
Robbie Gonzalez
6/09/15 2:40pm
Where
in the U.S. are UFO sightings most common? What shapes do these
unidentified objects usually take? What time of day do we typically
notice them? Datavisualization expert John Nelson combined census data
with nearly 90 years of statistics, compiled by the National UFO Reporting Center, to find out.
“Of course,
as is the case for any observation data, there is a strong tendency
towards echoing a population map,” Nelson writes on his blog.
“This is certainly the case with this sighting data, as well. In order
to visualize the actual sighting phenomenon, I needed to normalize by
the underlying population.”
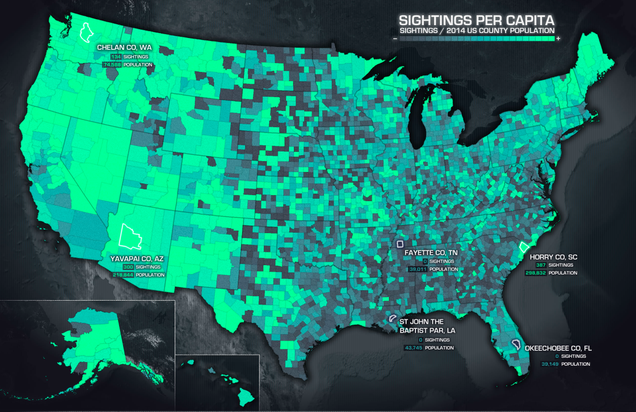
The maps below are what he came up with (click to enlarge). Keep scrolling for his detailed explanation.
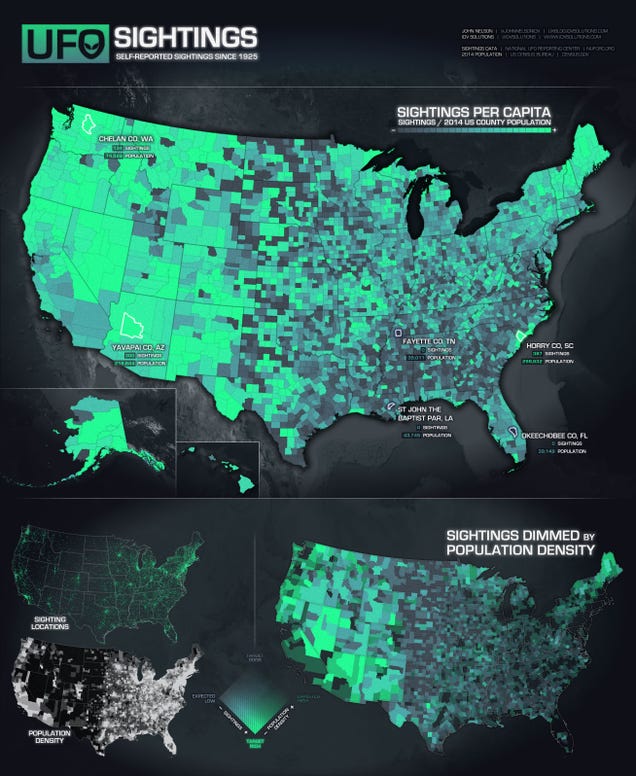
The first, more prominent map shows a simple ratio of the sightings by population. A per-capita approach. The second, smaller and slightly more complex map, shows a bi-variate mapping of sightings in the color dimension (dark slate for low-sightings and bright green for high-sightings) and population density in the opacity dimension (denser populations are more transparent). The result is a map that is more nuanced regarding the problem of variable populations and area sizes. Double normalized? Sort of. If you would like to traverse the rich and complex world of bi-variate mapping, check out this tour-de-force how-to by Joshua Stevens.
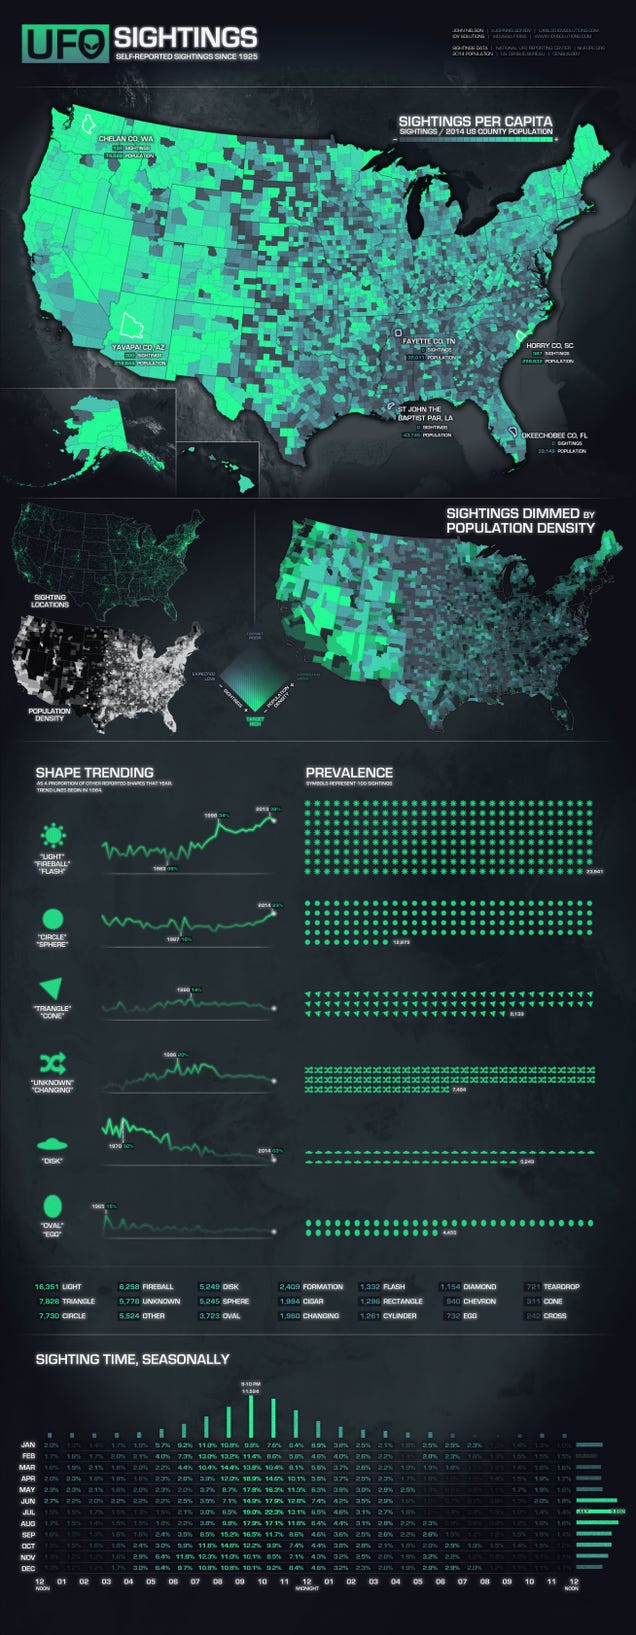
Also
represented in Nelson’s visualization (below, click to embiggen) are
data on UFO-shape (e.g., the prevalence of “fireball” shaped UFOs, which
has been increasing steadily for the last few decades, relative to
sightings of disc-shaped UFOs, which have petered out), and the times at
which UFOs are most commonly spotted, by season.
No comments:
Post a Comment